April 27 Update on Class Structure for the Remainder of the Year!
- I’m going to be doing demonstrations on Zoom every Tuesday from 9-10! They will not last the entire hour, but please try to log in right at 9 so we can start promptly! Each demo will have a short reflection due the following Friday. I will post a video of the demo on Classroom and our website if you are not able to make the Zoom meeting on Tuesday. I will send you the link to our meeting in an email before our first one.
- Thursdays, I will do a help session on Google Hangouts from 9-10 to answer any questions you have about any of the assignments. You don’t have to be there, or you can just pop in, but I will be able to answer questions you have immediately! I am also open to creating more help sessions in Google Hangouts if students can’t make this time frame!
- One of the most important - do NOT spend more than 30-45 minutes per day on work for our class! My goal is to do short assignments with some longer projects built in. If you are unable to access something that has been posted, please email me immediately so we can get it figured out! :)
Monday, April 27 - Friday, May 1
Schoolwork
We are starting Oceanography this week!
We are starting Oceanography this week!
- Google Classroom - finish review from Climate Change packet before break and take notes. It is in Nearpod again and self-guided this time (check for the link and code in Classroom). It is only about 10 slides of information. Notes, Keywords, and Summary due Friday (May 1)!
- Tuesday is Demo Day on Zoom from 9-10 (it shouldn’t take the whole hour). There will be a super short reflection on it due Friday (May 1) in Google Classroom
- Oceanography Activities to Try at Home - This will be posted on Google Classroom either Monday or Tuesday. Choose one from a list of activities to do and post about on Sutori (more information to come about that! It’s a collaborative platform) by May 6 (next Wednesday)
Monday, April 13-Thursday, April 16
Standards/Proficiencies:
HS-ESS2-4. Use a model to describe how variations in the flow of energy into and out of Earth’s systems result in changes in climate.
HS-ESS3-5. Analyze geoscience data and the results from global climate models to make an evidence-based forecast of the current rate of global or regional climate change and associated future impacts to Earth's systems.
Schoolwork:
1. Tuesday or Thursday - Google Hangout Review Session from 9-10 am (will send out a link via email to all of my 9th graders!) - It will probably not last the entire time, but will start at 9am!
Please email me with any questions or concerns!
1. Tuesday or Thursday - Google Hangout Review Session from 9-10 am (will send out a link via email to all of my 9th graders!) - It will probably not last the entire time, but will start at 9am!
- We will use a program called "Nearpod" to deliver review information! Students will take notes in our typical notes format (there will be a digital copy on Google Classroom or students can create their own in a notebook or other piece of paper)
- Review Topics:
- Climate Chapter - main concepts
- Factors that affect climate
- Climate zones
- Climate change
- Homework (Due Thursday, April 16) - Do Keywords/Questions and 3-5 Sentence Summary from the notes/review session
- Climate Chapter - main concepts
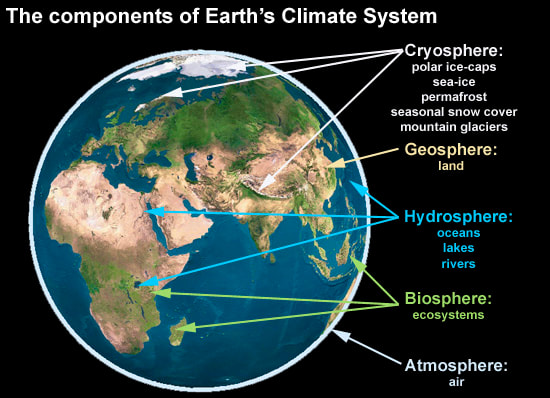
- Earth's Spheres - In your own Backyard!
- 1. Watch the video below and/or check out the infographic about the different spheres of the Earth.
Earth's Spheres Video - https://www.youtube.com/watch?v=m4TnPv_b6WU
2. GO OUTSIDE - take a picture (you can do this with a phone, Chromebook, etc.), sketch, paint, etc. of your backyard, a local hike, etc. Then, list the different components of each sphere (biosphere, geosphere, atmosphere, hydrosphere) from your picture! I have created an example for you to use as a guide. LOOK AT THIS BEFORE YOU GET STARTED!
3. OPTIONAL - List as many connections between the different spheres in your picture as you can. USE MY EXAMPLE TO HELP YOU WITH THIS!
This assignment is due Thursday, April 16.
- 1. Watch the video below and/or check out the infographic about the different spheres of the Earth.
Please email me with any questions or concerns!
|
|
|
March 23-27 - Climate/Climate Change
Standards/Proficiencies:
HS-ESS2-4. Use a model to describe how variations in the flow of energy into and out of Earth’s systems result in changes in climate.
HS-ESS3-5. Analyze geoscience data and the results from global climate models to make an evidence-based forecast of the current rate of global or regional climate change and associated future impacts to Earth's systems.
HS-ESS2-4. Use a model to describe how variations in the flow of energy into and out of Earth’s systems result in changes in climate.
HS-ESS3-5. Analyze geoscience data and the results from global climate models to make an evidence-based forecast of the current rate of global or regional climate change and associated future impacts to Earth's systems.
Assignments:
- Climate Chapter and section questions (due April 6)
- Daily Climate Data (ongoing)
- Climate/Climate Change Activities that can be done at home (due April 3)
March 18-April 6 Classwork
1. Checking the Weather - Weather Underground
-Check the weather for your location and a location of your choice for every day. Include the high temp, low temp, wind, pressure, and precipitation. If you miss a day, you can look back at the previous day.
-At the end of the week, compare the weather of that week to the same week from the previous year. You can look at graphs from the previous year! (you are not required to graph any data at home for the data you collect.)
-DO THE BEST YOU CAN! I have included the form on Google Classroom if you choose to do this digitally.
2. Climate Reading
-Over the course of the next two weeks, read Chapter 25 from the book on "Climate" and answer the questions at the end of each section. Then, do the review at the end of the chapter.
-I have paper copies of the chapter, but I am also providing a digital copy if that is something you would prefer. However, you cannot print anything from this link.
Earth Science Textbook
3. Be checking Google Classroom for some videos and reflection questions. (if you have concerns about accessing Google Classroom, please let the school know and I will be in touch with you!)
3/11/20 - Climate!
|
|
|
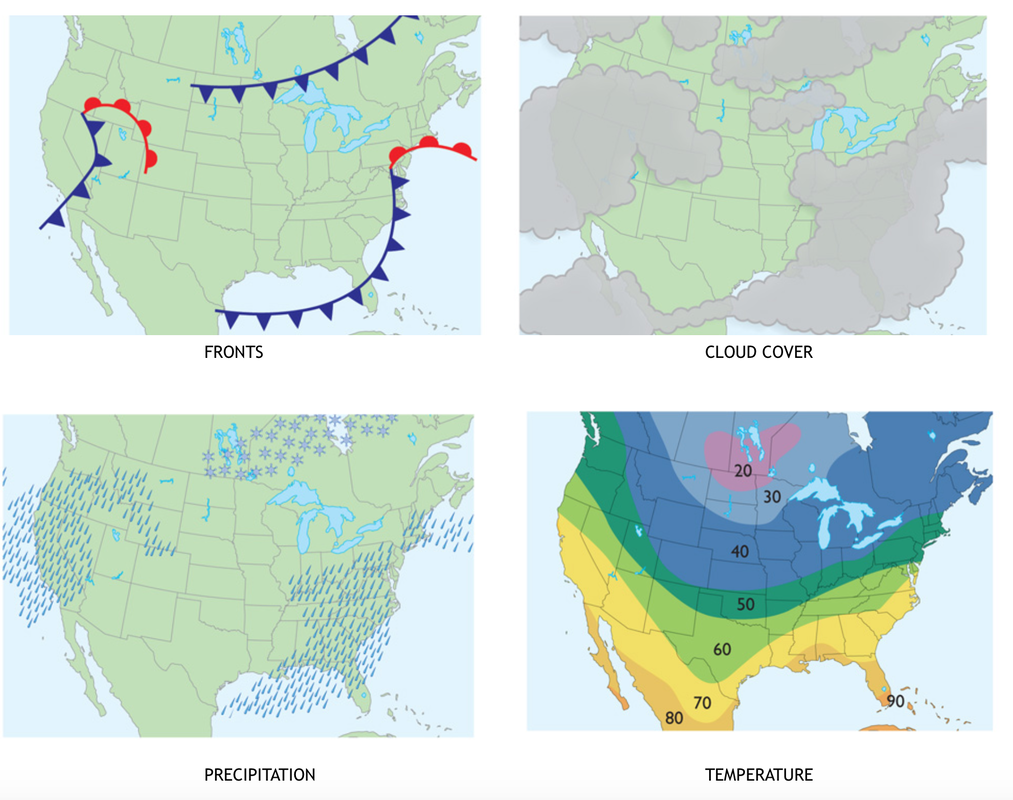
2/12/20 - Predict the Weather for tomorrow!
Using what you now know about weather in terms of air masses, fronts, high and low pressure, and wind, try to predict the weather for tomorrow.
1. Open up Weather.com and go to the classic weather map to see what the weather is like right now.
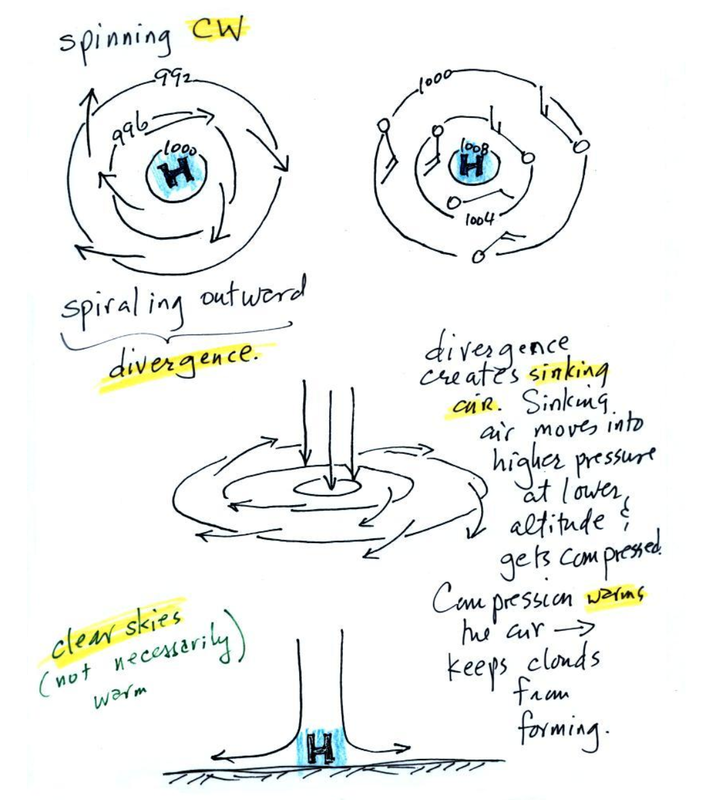
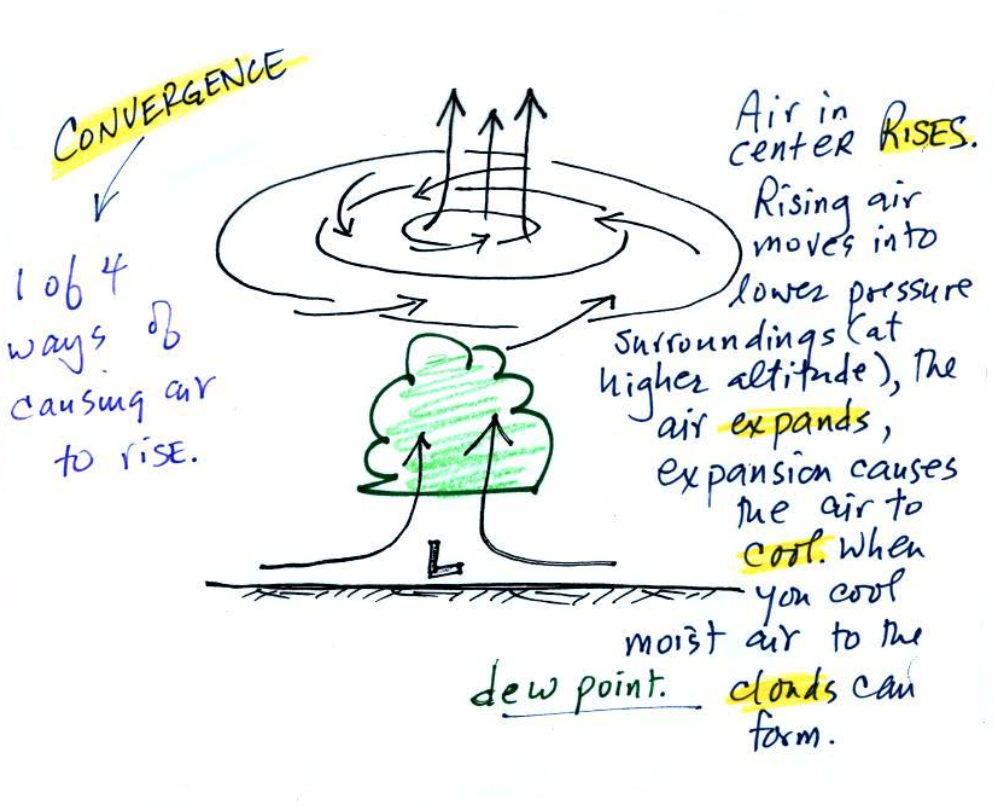
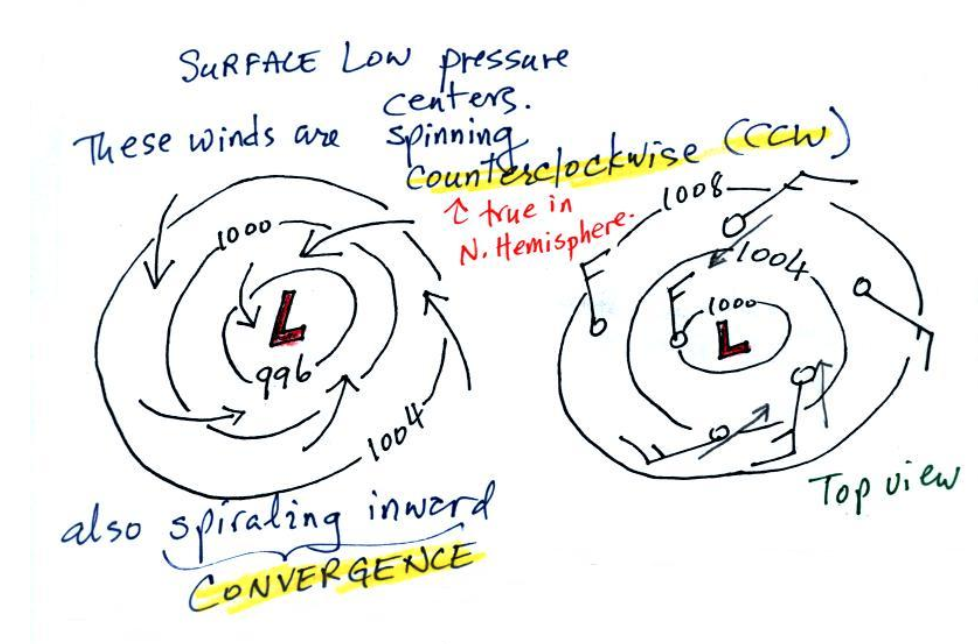
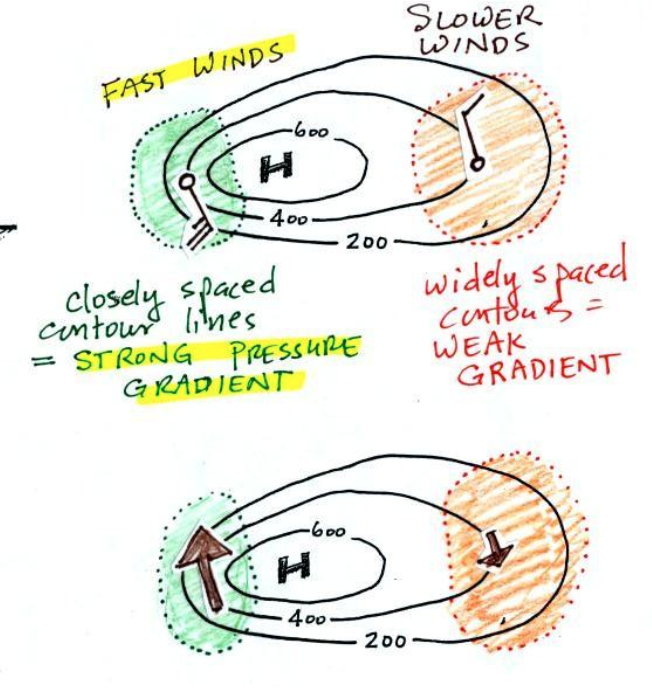
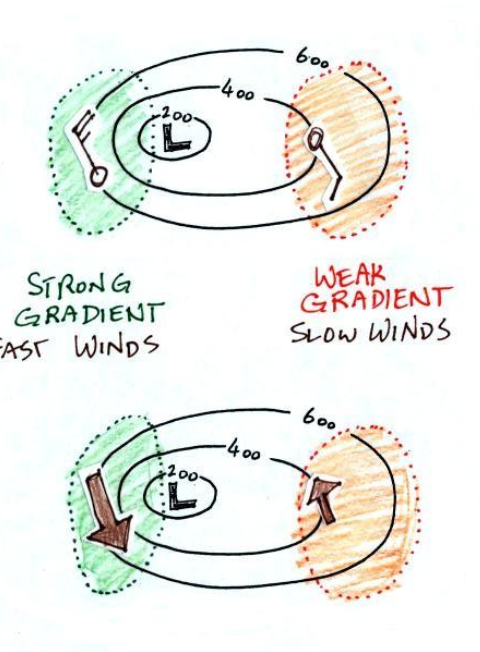
2. Use the diagrams and links below to help you make your predictions. Some of these links are from the Edji about pressure and wind (so if you haven't seen them, they should be helpful to you.)
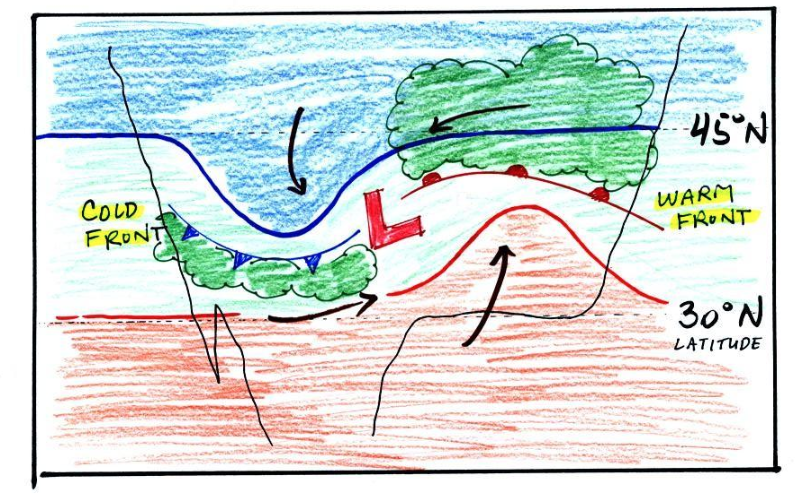
3. Draw your forecasted weather map on the blank map of the United States. Be sure to include important info - fronts, precipitation, high/low pressure, isobars, etc.
4. Take a picture (either with your laptop or computer) and post it to the assignment on google classroom and give a reasoning behind some of your predictions (why have fronts moved the way they have? What's happening with the fronts in terms of air masses? Etc.)
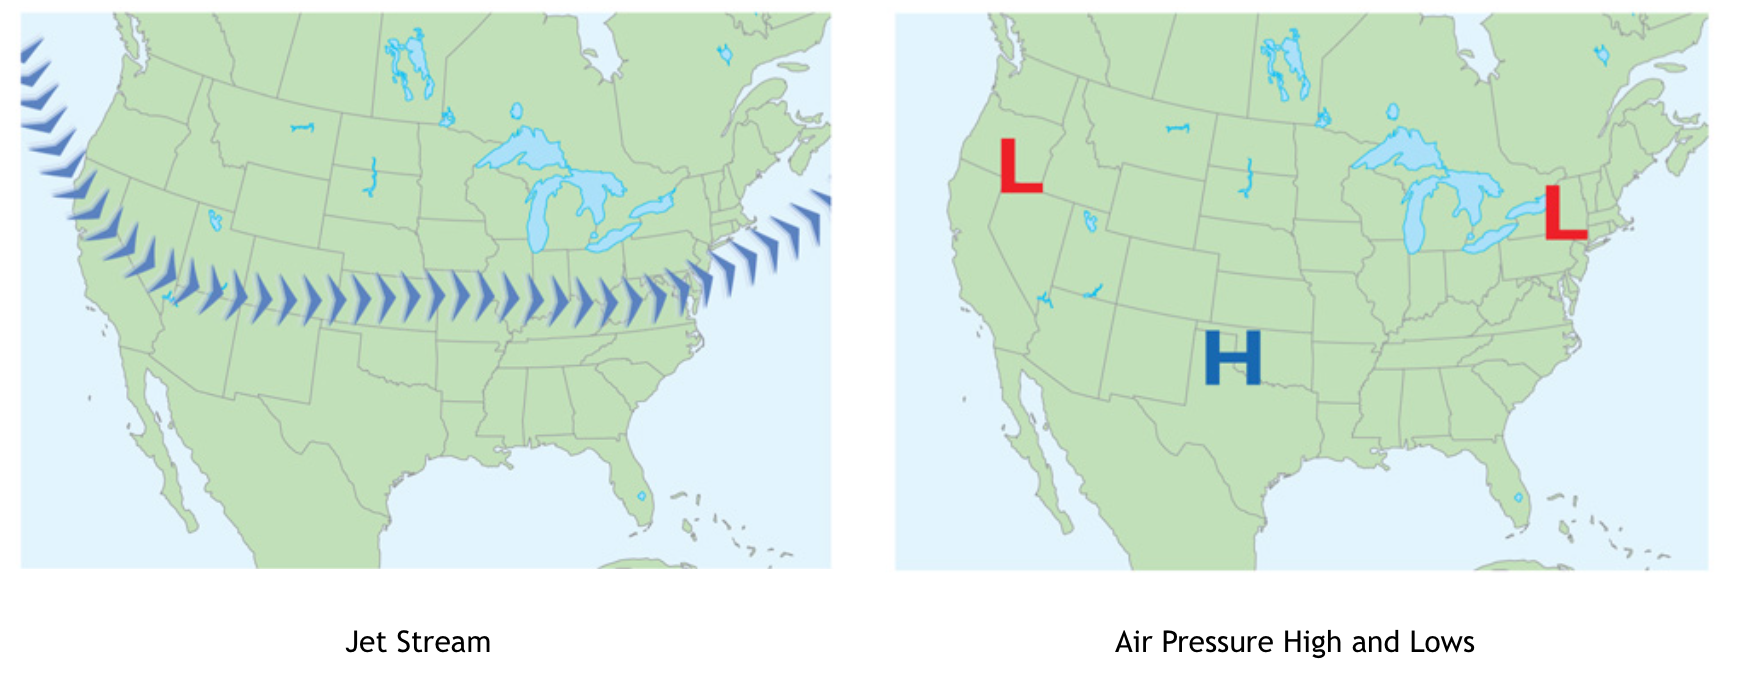
Important links on the Jet Stream - these are global air currents higher in the atmosphere that help direct our air masses moving from west to east. We will spend more time on it after vacation!
Jet Stream 1 - Real Time Visualization (this is what it looks like right now)
Jet Stream 2 - More Real Time Jet Stream maps
Jet Stream 3 - Forecasted Jet Stream
1. Open up Weather.com and go to the classic weather map to see what the weather is like right now.
2. Use the diagrams and links below to help you make your predictions. Some of these links are from the Edji about pressure and wind (so if you haven't seen them, they should be helpful to you.)
3. Draw your forecasted weather map on the blank map of the United States. Be sure to include important info - fronts, precipitation, high/low pressure, isobars, etc.
4. Take a picture (either with your laptop or computer) and post it to the assignment on google classroom and give a reasoning behind some of your predictions (why have fronts moved the way they have? What's happening with the fronts in terms of air masses? Etc.)
Important links on the Jet Stream - these are global air currents higher in the atmosphere that help direct our air masses moving from west to east. We will spend more time on it after vacation!
Jet Stream 1 - Real Time Visualization (this is what it looks like right now)
Jet Stream 2 - More Real Time Jet Stream maps
Jet Stream 3 - Forecasted Jet Stream
Use the images and diagrams below to help you with your weather prediction. (you will need to click on it in order to see the whole thing!)
2/3/20 Air Masses and Fronts
Watch the videos below about air masses and fronts. Take notes on your Cornell notes paper in the Notes section.
|
|
|
Here are some helpful links for your weather predicting
Jet Stream 1 - Real Time Visualization (this is what it looks like right now)
Jet Stream 2 - More Real Time Jet Stream maps
Jet Stream 3 - Forecasted Jet Stream
Jet Stream 1 - Real Time Visualization (this is what it looks like right now)
Jet Stream 2 - More Real Time Jet Stream maps
Jet Stream 3 - Forecasted Jet Stream
1/29/20 - Weather Pre-Assessment - Weather Maps!
On the back of your assignment, write/draw as many observations, connections, predictions you can about these maps, what they predict, and how they might be connected!
1/28/20 - Sorry, Saikin is out again :(
Stupid sickness! Sorry folks, I hate to be out again. I should be back tomorrow! Until then - Here's what you need to do while I'm out...
1. Finish yesterday's assignment. If you did not get to finish that, now is the time. It should be done by the end of class. If you did it on Google Classroom, check it, as I probably left you some feedback!
2. If you are done with yesterday's assignment, grab your journal. Follow these steps.
a. Title the next page "Glaciers vs. Icebergs."
b. Divide the page in half from top to bottom. Title the left side "My First Thoughts" and the right side "My New Thoughts."
c. On the left side, write (or draw) what you think the difference between glaciers and icebergs is, if there is any difference. Remember, these are your thoughts. NO RESEARCH!
d. When you are done, click the button below. Remember, you should ONLY have thoughts in the left column. Your right hand column should still be empty.
1/27/20 Plans while Ms. Saikin is out
Choose one of the articles below and read it. Then, you have several choices:
You may work alongside someone, but you need to have your own work done!
Choose one!
Record heat is burning the Arctic and melting Greenland's ice.
Animal graveyard found in deeply buried Antarctic lake.
Climate change cripples planet's glaciers and ice caps.
- Write a one-page summary (in your own words) of the article.
- Write a half- to one-page summary in your own words on Google Classroom (print and tape in your journal when done).
- Draw a model that summarizes the model in your journal.
You may work alongside someone, but you need to have your own work done!
Choose one!
Record heat is burning the Arctic and melting Greenland's ice.
Animal graveyard found in deeply buried Antarctic lake.
Climate change cripples planet's glaciers and ice caps.
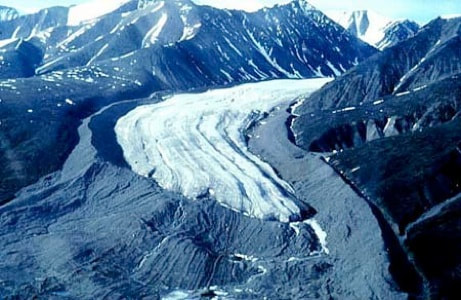
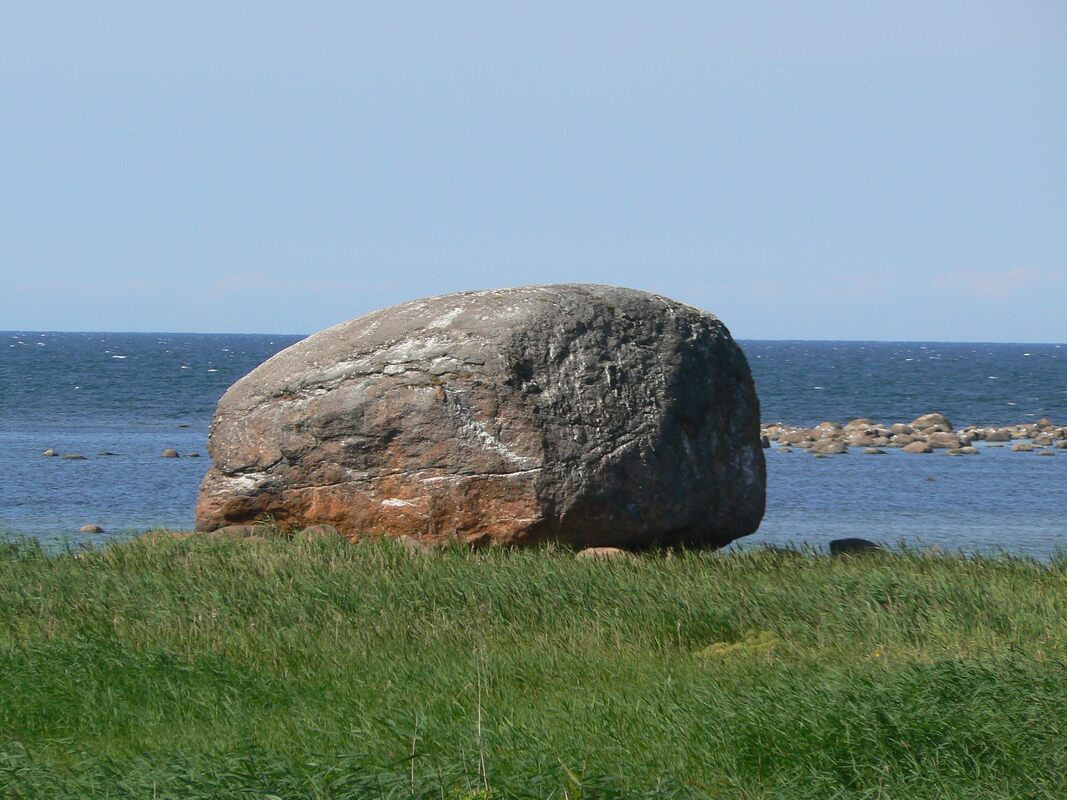
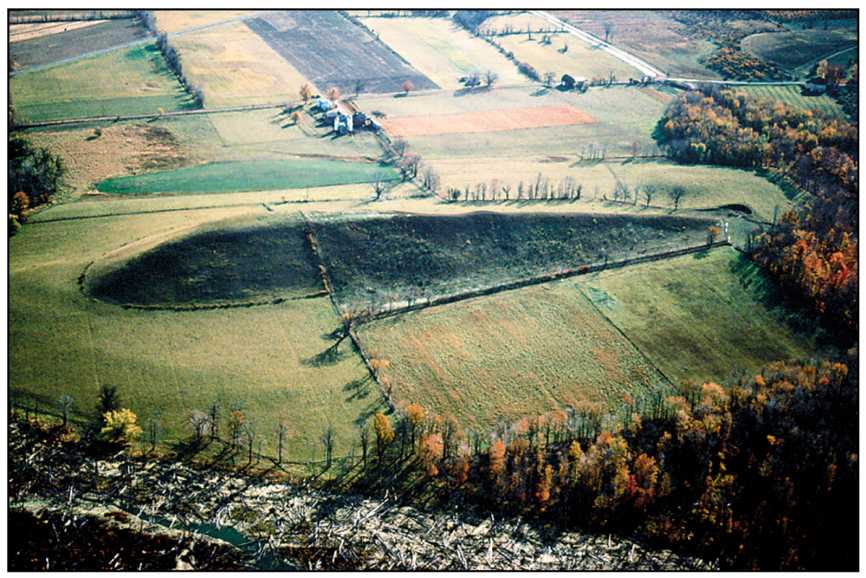
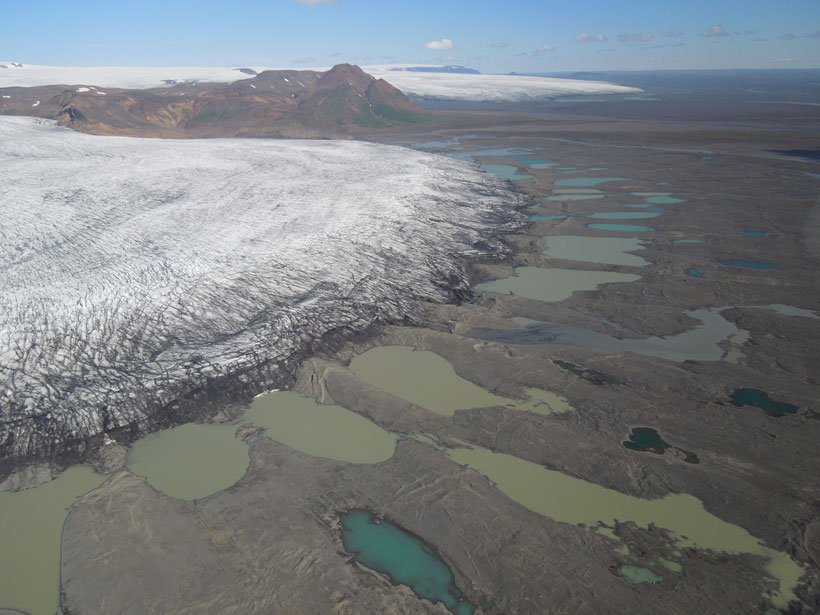
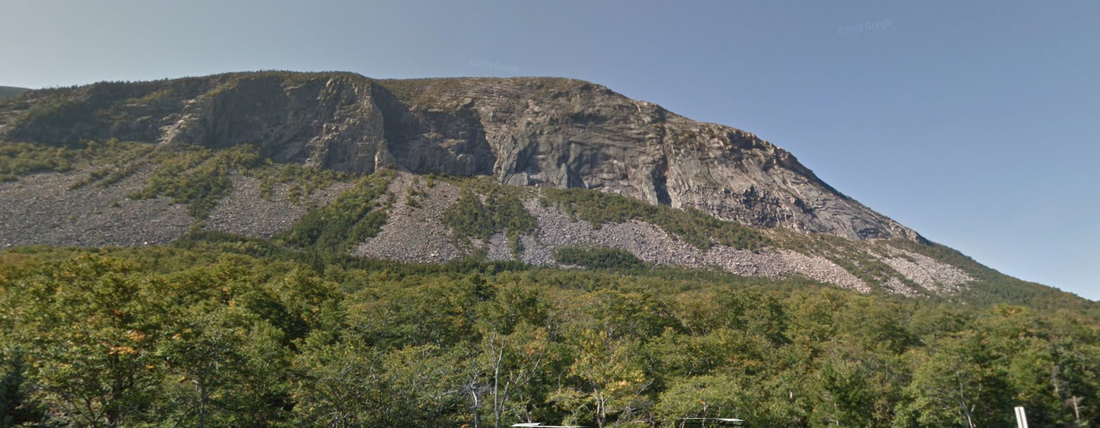
1/23/20 - Glacial Landforms
You and your group will look at the pictures below of different glacial landforms. You need to determine the type of landform it may be. If you cannot decide, you may narrow it down to two or three possible landforms. You may also do a diagram to help show this. Also include how glaciers make these (how do they change the land to make it look this way?)
This link will be helpful!
Glacial Landforms
This link will be helpful!
Glacial Landforms
1/22/20 Erosion Simulation

1/21/20 - Wolves of Yellowstone
1/13/20-1/17/20 - Midterm Links That Might Be Helpful
I'm providing some links that may be helpful for your project! If you still need something, let me know!
Glaciers
Erosion
Glaciers
Erosion
1/9/20 Second Quarter Project/Midterm
Your midterm will be to revisit these landforms. In groups of 2 or 3, you will choose 1 to research and present on. The goal is to have every group do a different landform (so no two groups will have the same landform). For today, start focusing on researching the following:
As part of your project, you will also need to include the following:
Be creative with your project! Possible ideas...
- How was your landform created
- When your landform was created
As part of your project, you will also need to include the following:
- An explanation or demonstration of how the processes that created your landform works (for example, how does wind erosion occur? How are mountains created?)
- The types of rocks that are found at that formation and how they could have been formed (think about what we know about metamorphic, igneous, and sedimentary rock)
- What did the Earth look like when this landform was created? (was it a supercontinent? Was there an ice age? Etc)
Be creative with your project! Possible ideas...
- Websites
- Documentaries/Videos
- Posters
- Timeline
|
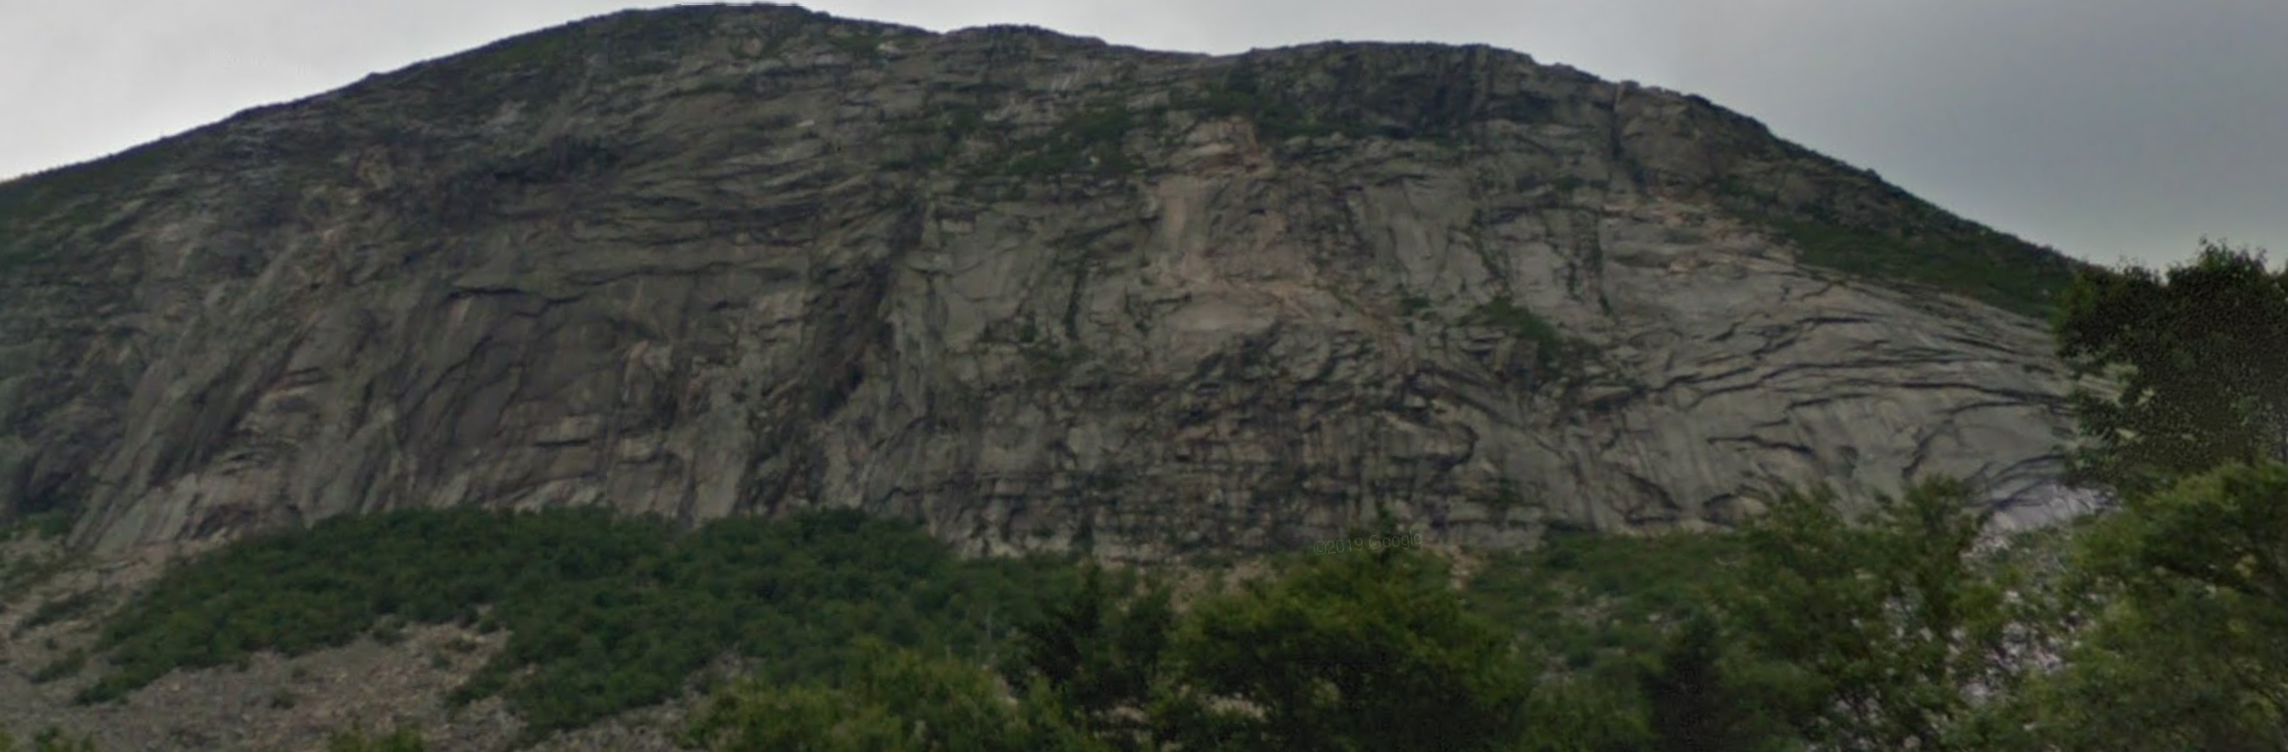
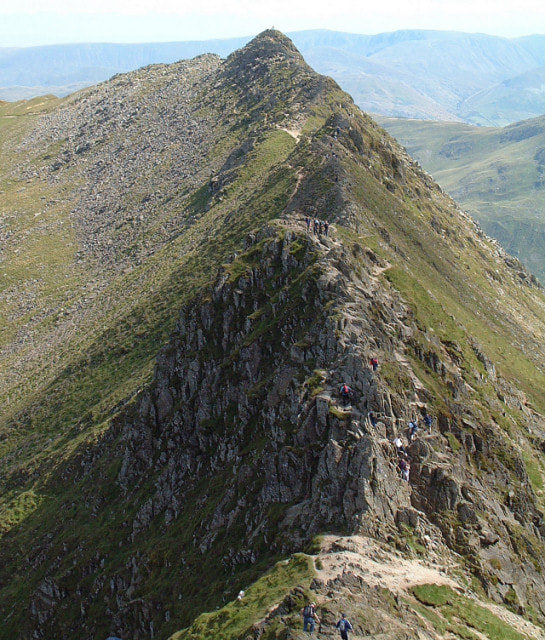
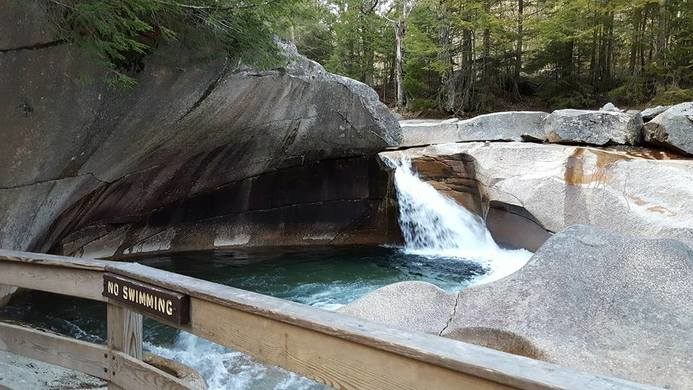
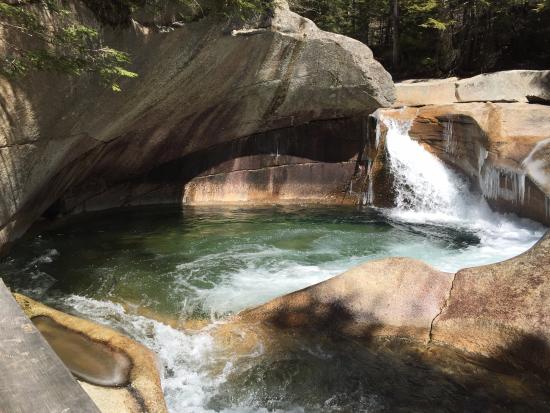
The Basin
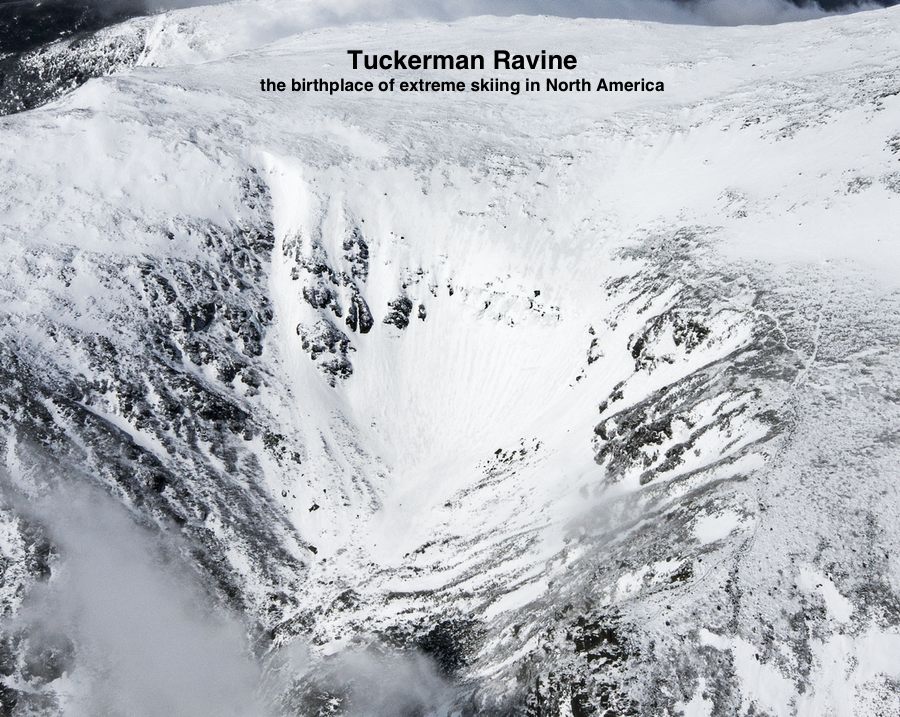
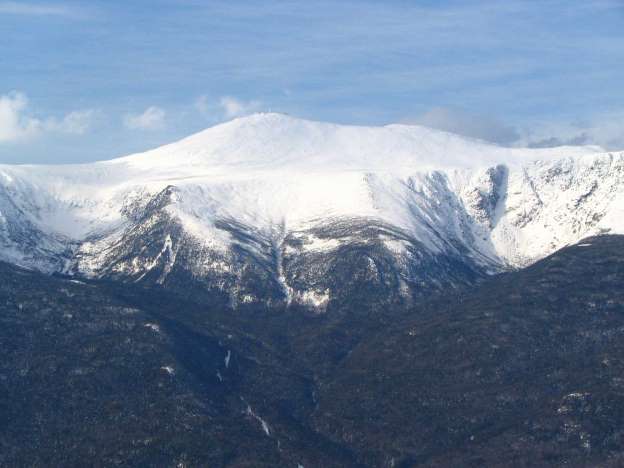
Tuckerman and Huntington Ravines (Mt. Washington)
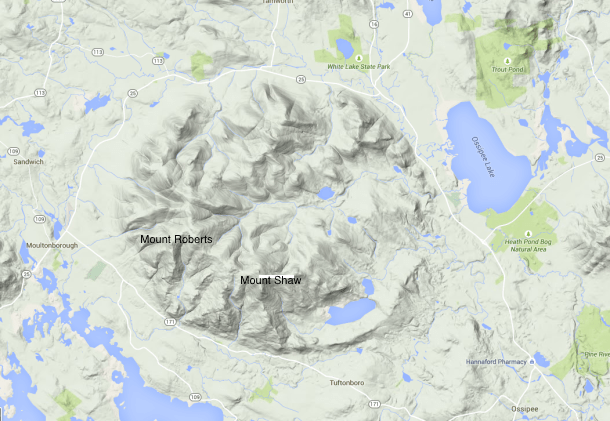
Mount Ossipee Ring Dike
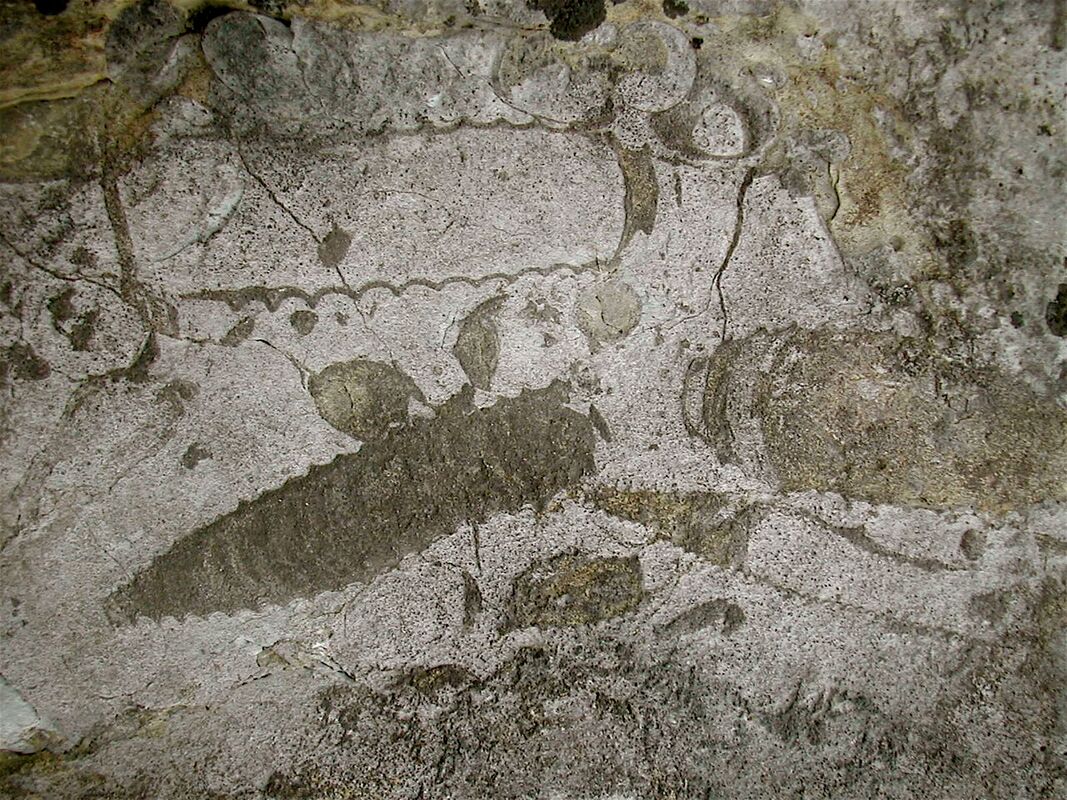
Chazy Fossil Reef
|
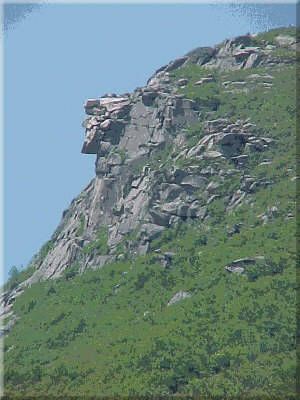
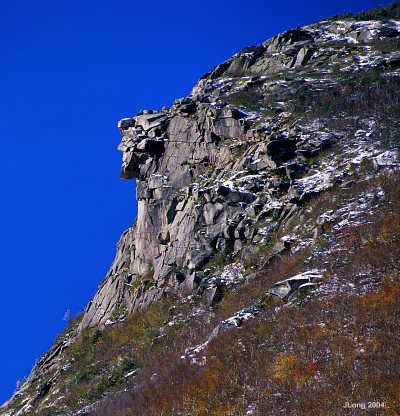
Old Man of the Mountain (formation and fall)
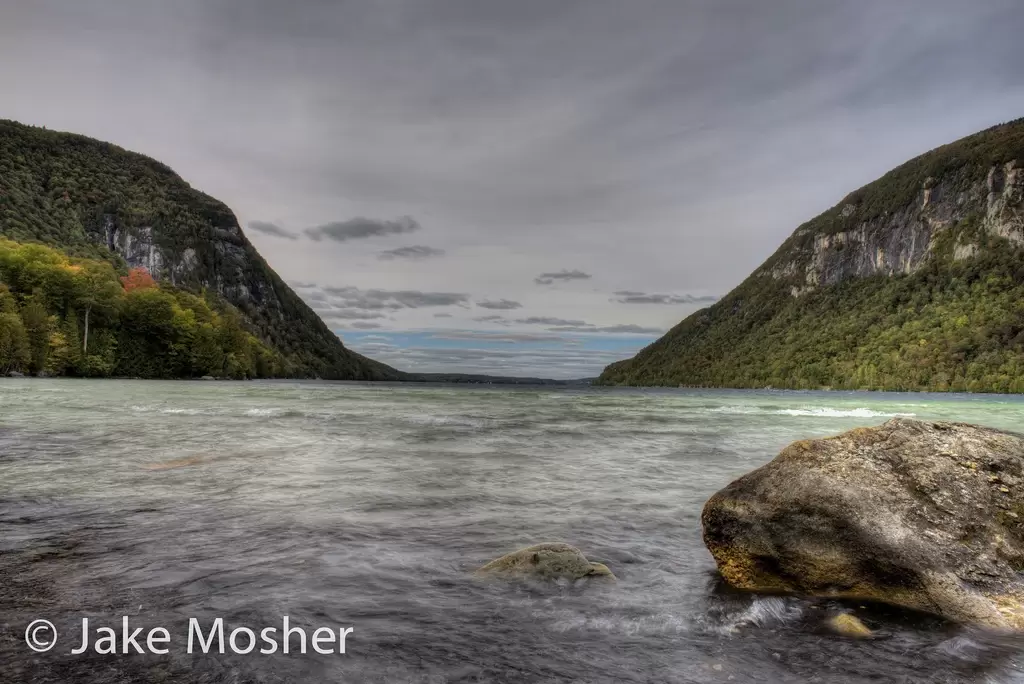
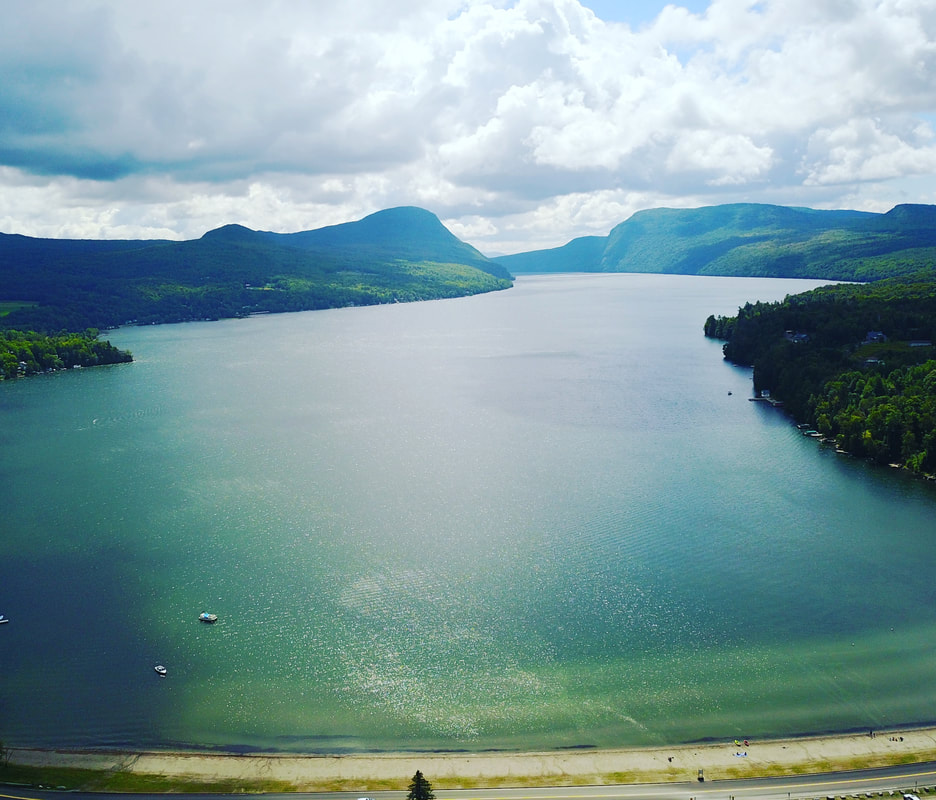
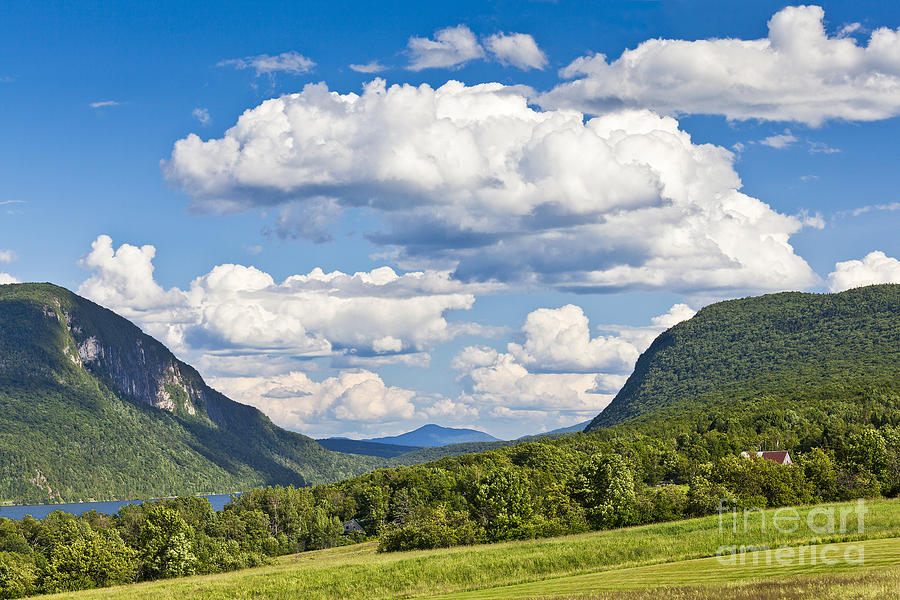
Willoughby Gap/Lake Willoughby
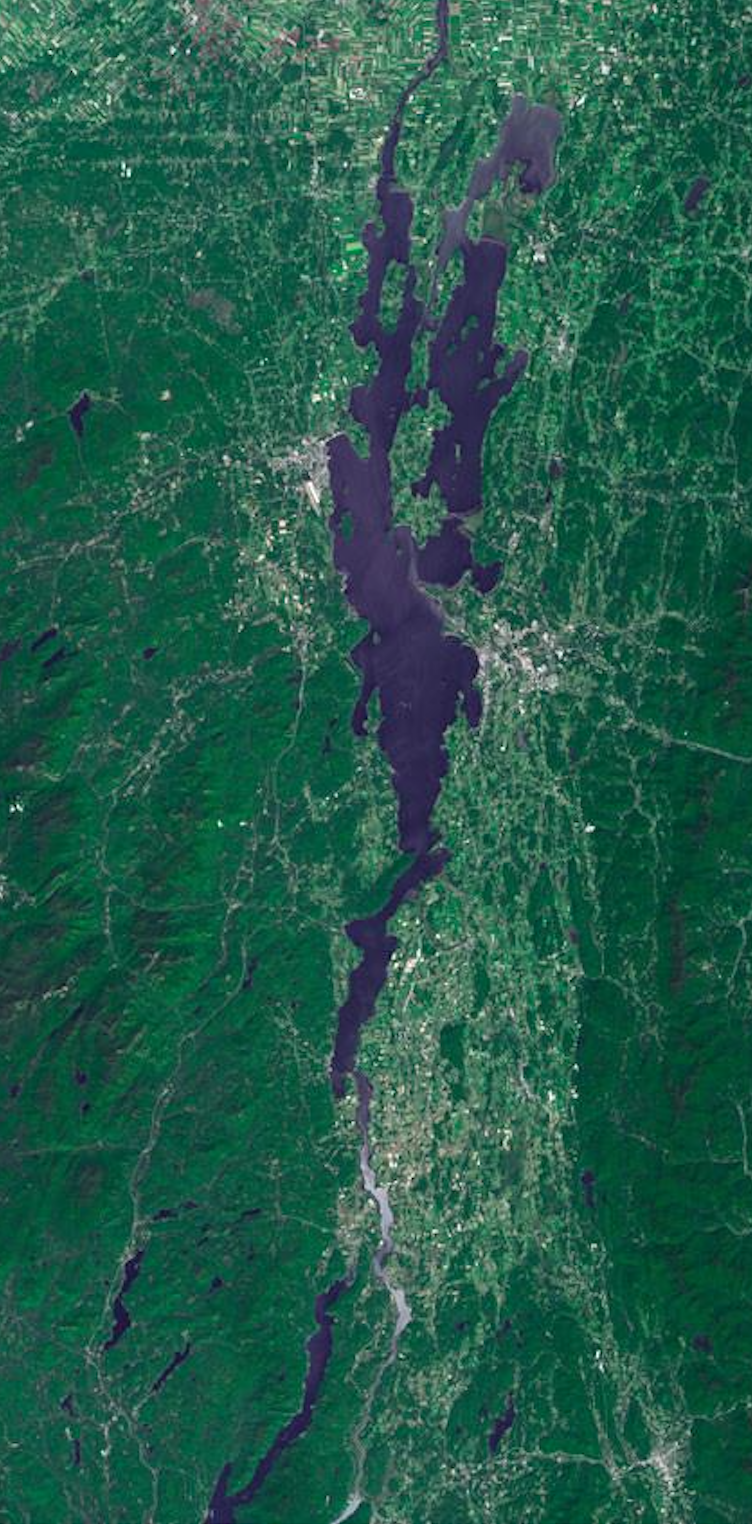
Lake Champlain
|
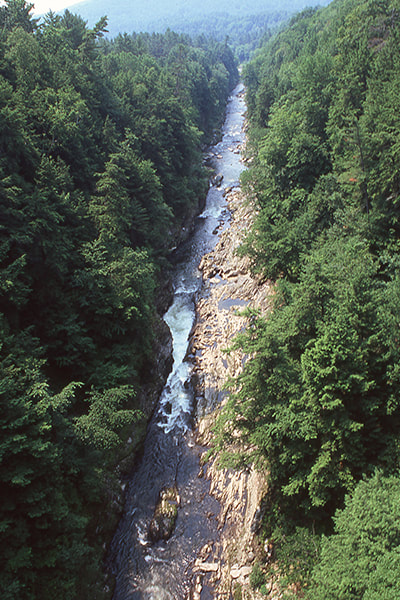
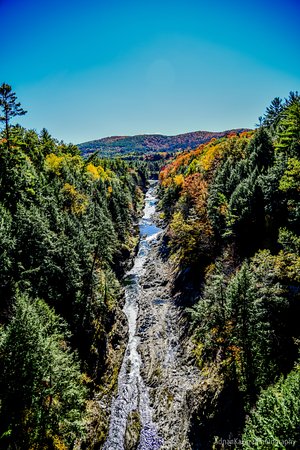
Quechee Gorge
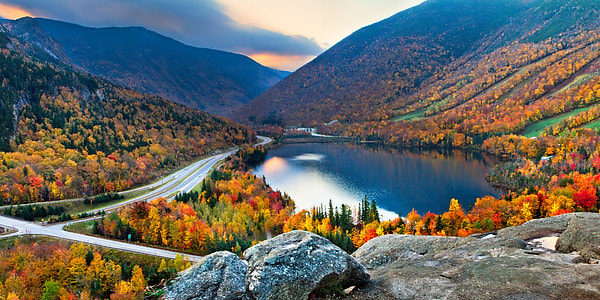
Franconia Notch
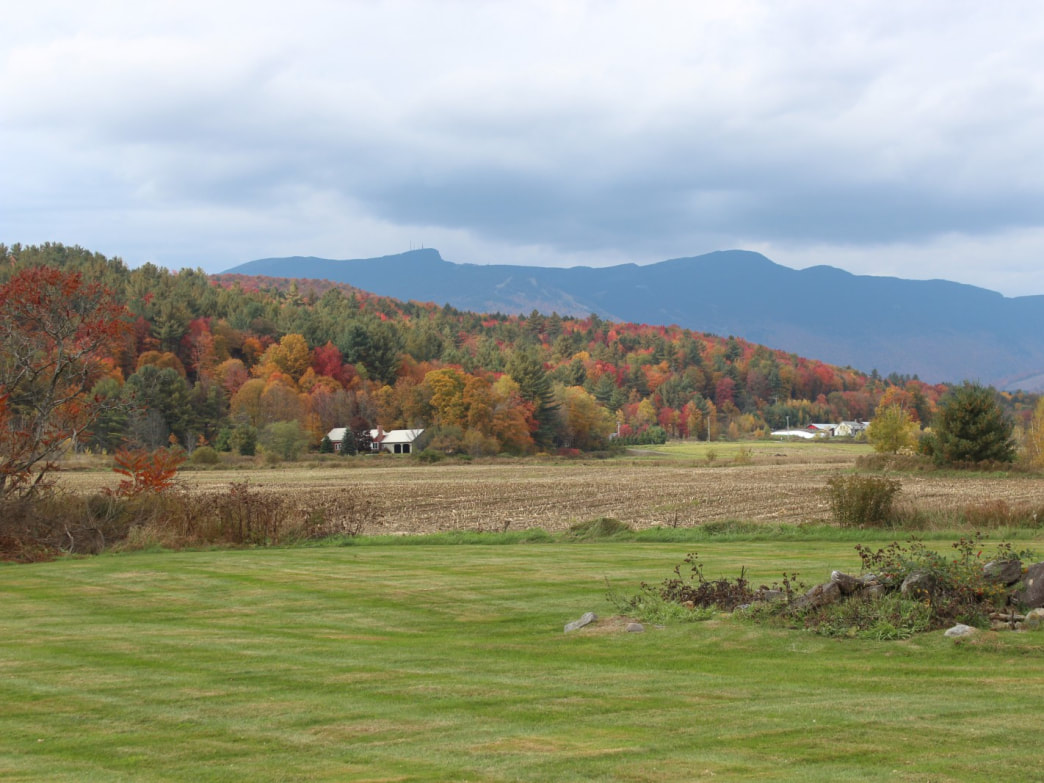
Mount Mansfield Face
|
Daily Check-In!
1/8/20 TED Talks
Watch this TED Talk first
https://www.ted.com/talks/david_christian_the_history_of_our_world_in_18_minutes
After you finish that one, if you have time, pick another one of these :)
https://www.ted.com/talks/laura_robinson_the_secrets_i_find_on_the_mysterious_ocean_floor
https://www.ted.com/talks/francesco_sauro_deep_under_the_earth_s_surface_discovering_beauty_and_science
https://www.ted.com/talks/james_balog_time_lapse_proof_of_extreme_ice_loss#t-584456
https://www.ted.com/talks/jack_horner_building_a_dinosaur_from_a_chicken
https://www.ted.com/talks/tshering_tobgay_an_urgent_call_to_protect_the_world_s_third_pole
12/18 - Skittlium and . Blakium Data
12/16/19 - Geologic Coring Resources for your website
These are websites and videos that explain and/or show more real world applications to core drilling across the world. These are resources!
https://www.jamstec.go.jp/cdex/e/operations/drilling/coring.html
https://joidesresolution.org/core-science-1-what-is-coring-and-what-does-it-tell-us/
https://oaklandgeology.com/2017/08/14/coring/
https://www.jamstec.go.jp/cdex/e/operations/drilling/coring.html
https://joidesresolution.org/core-science-1-what-is-coring-and-what-does-it-tell-us/
https://oaklandgeology.com/2017/08/14/coring/
|
|
|
12/11/19 - Bones of Badger Hole
Watch this video while Ms. Saikin is out today.
In your journal - write down different types of technology or methods they use to understand the rocks and ground underneath the surface to help them find the fossils.
In your journal - write down different types of technology or methods they use to understand the rocks and ground underneath the surface to help them find the fossils.
11/15/19 - Plans while Ms. Saikin is out
Today, you are continue where we left off on Friday about fluorescent minerals and rocks.
Read about fluorescence in the two articles below.
Fluorescence and Light
Fluorescent Minerals and Rocks - There's a lot going on in this article. For now, don't read past the section "Fluorite, the original fluorescent mineral."
Using the information from these articles, create a model in your journal of how fluorescent minerals glow different colors under UV light. Think about the following:
DO THE BEST YOU CAN! Don't be afraid to try something. That's how you learn!
Read about fluorescence in the two articles below.
Fluorescence and Light
Fluorescent Minerals and Rocks - There's a lot going on in this article. For now, don't read past the section "Fluorite, the original fluorescent mineral."
Using the information from these articles, create a model in your journal of how fluorescent minerals glow different colors under UV light. Think about the following:
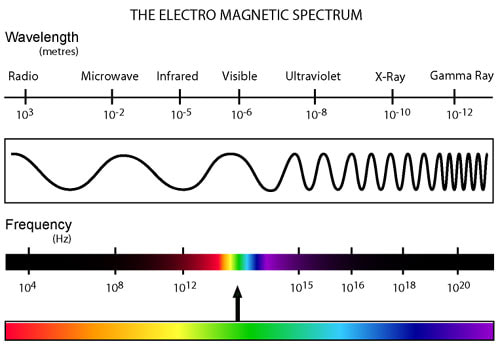
- The UV rays and the energy it has as it hits the rocks
- What's happening with the electrons in those rocks to cause us to see fluorescence.
- The colors we see coming off the rocks and their wavelengths as a result of those electrons moving around
DO THE BEST YOU CAN! Don't be afraid to try something. That's how you learn!
11/20/19 - Fluorescent Rocks Part 2
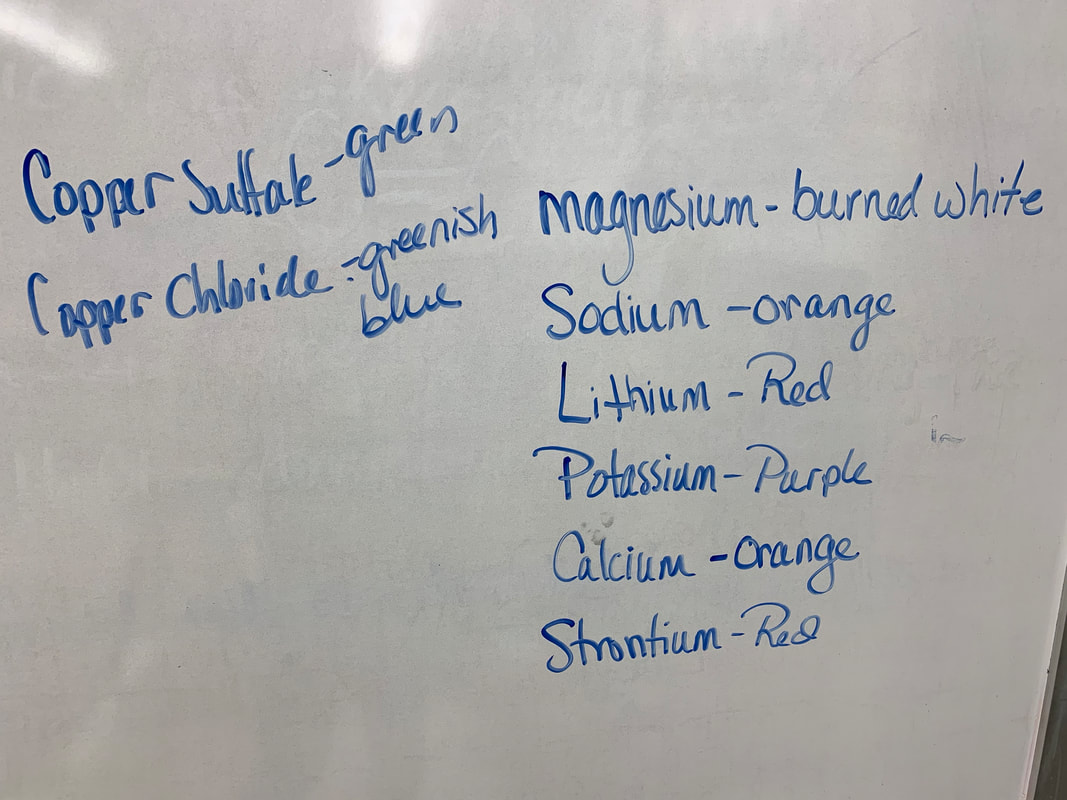
With people at your table (2-3 per group), you will create a group model of the fluorescent rocks. We are taking it to the next level. We are now going to look at why we see different colors of fluorescent light. We are going to bring it back to the flame test we saw with Dr. Carson.
Why do different metals/salts burn different colors?
I am leaving this very open ended for a reason. I want to see what you come up with. But it should connect to what we did in your models yesterday (about how electrons jump orbitals/shells).
Think about the following as you do this model:
You may do whatever research you need to create this. (except looking up how flame tests work). I am providing you with some information below. But do the best you can!
"The colors observed during the flame test result from the excitement of the electrons caused by the increased temperature. The electrons "jump" from their ground state to a higher energy level. As they return to their ground state, they emit visible light. The color of the light is connected to the location of the electrons and the affinity the outer-shell electrons have to the atomic nucleus.
The color emitted by larger atoms is lower in energy than the light emitted by smaller atoms. So, for example, strontium (atomic number 38) produces a reddish color, while sodium (atomic number 11) produces a yellowish color.
The sodium ion has a stronger affinity for the electron, so more energy is required to move the electron. When the electron does move, it reaches a higher state of excitement. As the electron returns to its ground state, it has more energy to disperse, which means the color has a higher frequency/shorter wavelength."
Why do different metals/salts burn different colors?
I am leaving this very open ended for a reason. I want to see what you come up with. But it should connect to what we did in your models yesterday (about how electrons jump orbitals/shells).
Think about the following as you do this model:
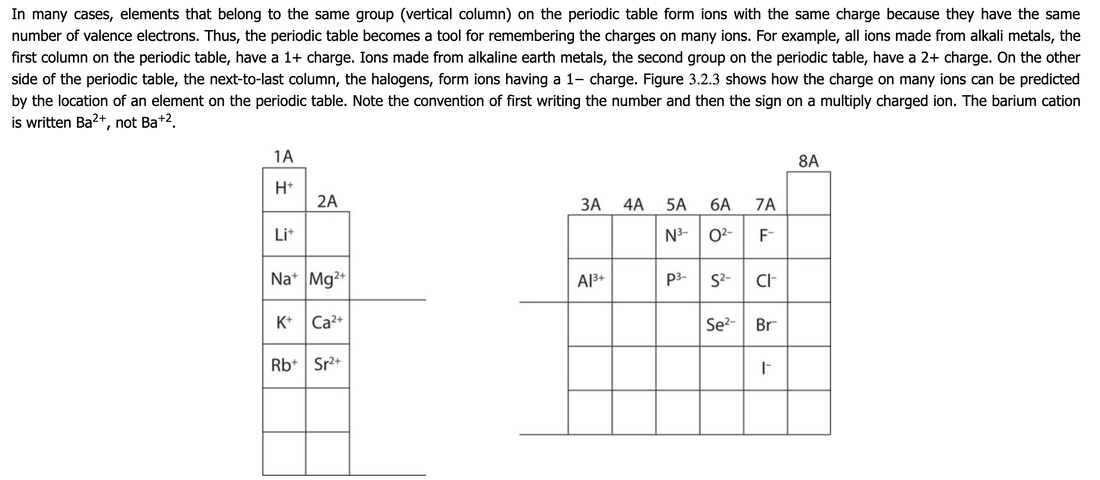
- Ions - how are they made? (what are cations and anions?)
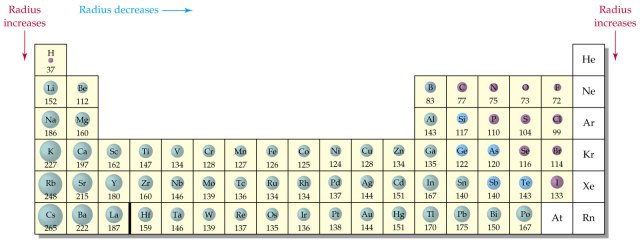
- What are the sizes of ions and why (think about what happens when they lose or gain an electron)
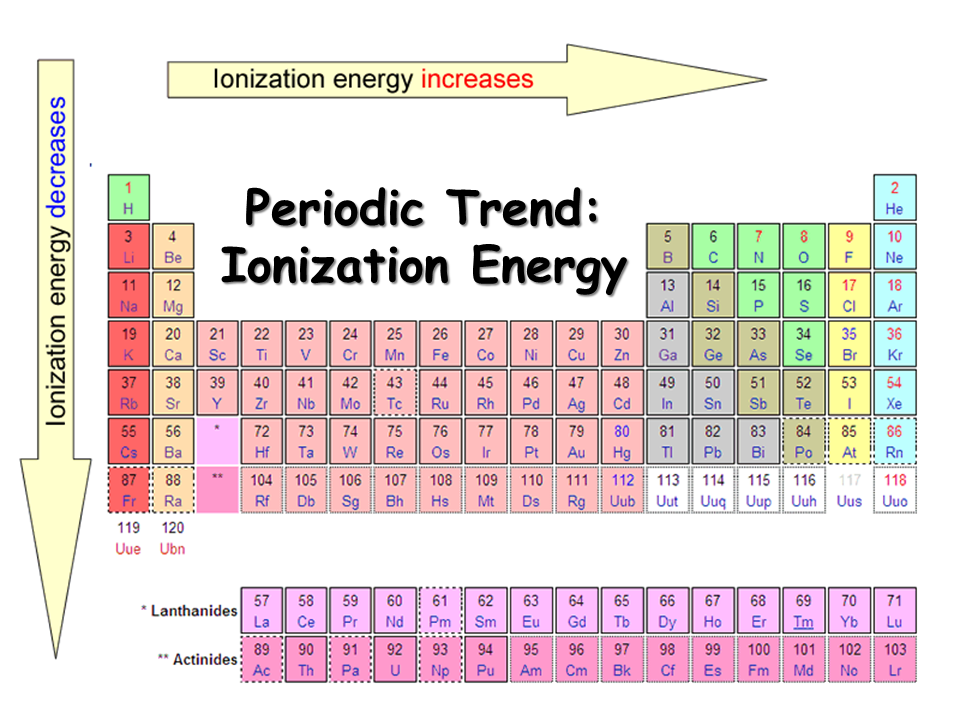
- What are the sizes of atoms going down a column in the periodic table
- Think about what made the salts burn and release energy in the form of light
You may do whatever research you need to create this. (except looking up how flame tests work). I am providing you with some information below. But do the best you can!
"The colors observed during the flame test result from the excitement of the electrons caused by the increased temperature. The electrons "jump" from their ground state to a higher energy level. As they return to their ground state, they emit visible light. The color of the light is connected to the location of the electrons and the affinity the outer-shell electrons have to the atomic nucleus.
The color emitted by larger atoms is lower in energy than the light emitted by smaller atoms. So, for example, strontium (atomic number 38) produces a reddish color, while sodium (atomic number 11) produces a yellowish color.
The sodium ion has a stronger affinity for the electron, so more energy is required to move the electron. When the electron does move, it reaches a higher state of excitement. As the electron returns to its ground state, it has more energy to disperse, which means the color has a higher frequency/shorter wavelength."
11/21 - Taking a Step Back
First thing's first... Tape a periodic table into your next journal page. Then, do the following:
- Color the symbols of the elements we saw in the flame test with the color they burned in the flame.
- Using the websites from Monday's activity, include an accurate sketch of the wavelength of those colors.
- Draw an atom of those elements that includes the shells for their electrons (remember - the first shell has 2 electrons, the second and third have up to 8 each). Then, draw the same atom as a cation.